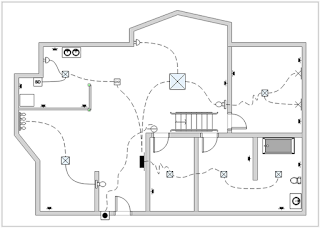
P&ID drawings, also known as Process and Instrumentation Diagrams, or Process and Control Diagrams, are essential to many industrial operations. This page is a basic guide on how to read and understand Piping and Instrumentation Drawings (P&IDs). What is Piping and Instrumentation Diagram? Piping and instrumentation diagram, also called P&ID, is a diagram used to show a graphical display of a complete system. It includes all piping, instruments, valves and equipment that the system consist of. How to Read Piping and Instrumentation Diagrams Here are a few aspects that you should pay attention to while reading a Piping and Instrumentation Diagram. 1. Read Standard Equipment -Instruments The first step to read a Piping and Instrumentation Diagram is to know how to read its symbols and shapes in the drawing. Edraw provides all kinds of symbols required in piping and instrumentation diagrams. Discrete instruments: Shared control/display Comp...


评论
发表评论