Understanding Value Stream Map and Related Concepts
Many people know the benefits of using value stream map, however, they still have many misunderstandings about several concepts like current state, flow analysis, takt time, etc., in the value stream map. Today, let's learn several concepts about value stream together.
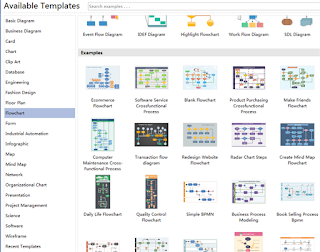
Edraw provides you lots of value stream shapes to better draw the value stream map. Also, Edraw includes several arrangement tools to help you layout value stream shapes neatly and evenly. Many pre-drawn value stream templates and examples are available for you to choose.
What Is Current State in Value Stream Map?
Whenever there is a product for a customer, there is a value stream. The challenge lies in seeing it. The current state is a snapshot of how the material and information flows in that value stream. A current state value stream map will enable you to see the complete door-to-door flow in your facility and to identify and prioritize areas for improvement. Before you create a current state map, you should have already identified the value stream you want to analyze.
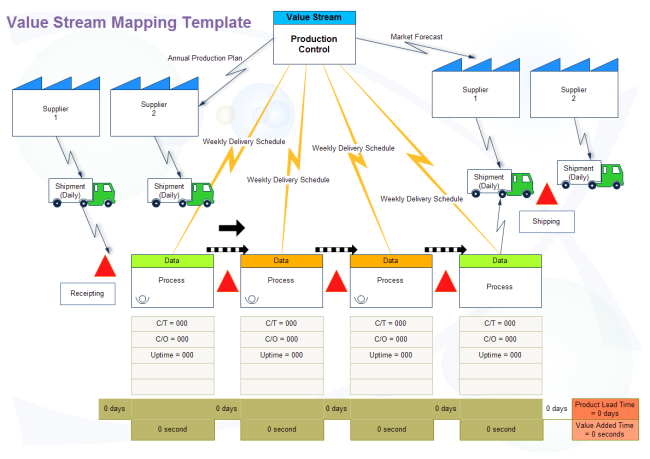
Below is a list of the information you need to collect at each process step for drawing a current state:
1. C/T Cycle Time - how often a part is completed by a process. Use a stopwatch if necessary. (In some cases, machines will give you this information).
2. C/O Changeover time - the time required to switch from producing one product type to another type.
3. Uptime - the percentage of time in which a machine or process is available on demand.
4. EPEI (production batch sizes) - the batch size expressed in time (days, etc.). EPE stands for "every part every _____."
5. Number of operators
6. Number of product variations
7. Pack Size - the number of items in a shipment
8. Working Time (minus breaks)
9. Scrap Rate
What is Flow Analysis in Value Stream Map?
Value stream map is not flowing analysis, but rather a simple tool that guides you through the process of analysis to improve flows and design better ones in the future. There might be some confusion about the concept " flow analysis" and we need to find out the difference and truly understand it.
First, value stream map does not equal "flow analysis" or the process of designing and creating optimum product flows. Value stream map is a simple tool to help operation managers and engineers (and others) understand how their flows currently operate and to help guide them through the process of analysis to improve those existing flows and design better ones in the future. Value stream map is a tool used to design optimum flow of product.
It is been misunderstood in some circles that value stream map, or takt time, or "lean flow," is only useful in highly repetitive, high volume, low variety manufacturing. This is a highly unfortunate and total misunderstanding. VSM is just a tool, as we said before, it is a tool to help people look at value streams rather than at discrete operations.
The issue of designing or creating lean product flow, however, is a much, much broader issue. Value stream map relates to that broader issue in that it is a tool to assist in that design.
What is Takt Time in Value Stream Map?
Takt time was developed as a manufacturing flow tool in the 1930s. The purpose of takt time is, first and foremost, to serve as a management tool to indicate at a glance whether production is ahead or behind. It serves as an alignment tool, aligning proceeding with following processes, aligning resource requirements with demand, aligning corporate functions with real-time production needs.
Rather than being limited to "repetitive production situations," takt time is actually most useful in helping establish flow under those very conditions when the flow is especially difficult to establish or see. Takt Time is a key concept in lean manufacturing. It is the heartbeat of a lean organization - matching actual production to customer demand.
Rather than being limited to "repetitive production situations," takt time is actually most useful in helping establish flow under those very conditions when the flow is especially difficult to establish or see. Takt Time is a key concept in lean manufacturing. It is the heartbeat of a lean organization - matching actual production to customer demand.
Let's look at several benefits of using takt time in the production process:
ƒ 1. Help you to achieve a steady and continuous flow of production.
ƒ 2. Eliminate the waste of overproduction by producing to actual customer demand.
ƒ 3. Encourage the development of standardized work instructions, promoting quality and efficiency.
ƒ 4. Enable you to set real-time targets for production that show operators exactly where their work output should be at any given point in time.
ƒ 5. Make it easier to establish what-if scenarios for customer demand based on flexible manning.
Resource from https://www.edrawsoft.com/understanding-value-stream.php

评论
发表评论