博文

目前显示的是 四月, 2018的博文

Understanding Value Stream Map and Related Concepts

图片
Many people know the benefits of using value stream map, however, they still have many misunderstandings about several concepts like current state, flow analysis, takt time, etc., in the value stream map. Today, let's learn several concepts about value stream together. Edraw provides you lots of  value stream shapes  to better draw the value stream map. Also, Edraw includes several arrangement tools to help you layout value stream shapes neatly and evenly. Many pre-drawn value stream templates and examples are available for you to choose. Complete Value Stream Mapping Guide What Is Current State in Value Stream Map? Whenever there is a product for a customer, there is a value stream. The challenge lies in seeing it. The current state is a snapshot of how the material and information flows in that value stream. A current state value stream map will enable you to see the complete door-to-door flow in your facility and to identify and prioritize areas for improvement. Be...
Easy Wireframe - Fast and Easy Wireframing Tool

图片
Easy Wireframe is used to draw wireframes for the website, iOS and Andriod applications that showcase your work. It lets you start with a straightforward drag-and-drop interface and a large collection of built-in elements. It runs on Mac, Windows and Linux platforms, and supports cloud collaboration. EASY WIREFRAME MAKER Create stunning wireframes and speed documentation work with streamlined wireframe maker. With massive wireframe kit for iPhone, iPad, Android, and Windows, you can sketch good-looking wireframes anytime and anywhere. 1 click will export the wireframe into many other formats. Even beginners can handle it effortlessly as the interface is similar to MS Word. Furthermore, it enables data storage in clouds, helping team members to share, review and co-edit documents. BASIC WIREFRAME DESIGN SYMBOLS You can find more than 600 common symbols in total for designing website wireframe, android wireframe, iPhone wireframe, iPad wireframe, windows 7 wireframe and more....

What is Work Breakdown Structure? - Definition, Uses and Benefits

图片
Here elaborates the basic knowledge of Work Breakdown Structure (WBS) along with its main uses and benefits. Work breakdown structure is popular and widely used in managing large projects. But, do you know what the work breakdown structure is, how it works and what exactly its main features are? This page illustrates what definitely work breakdown structure is and what its main uses are. Definition - What is Work Breakdown Structure? Work breakdown structure  (abbreviated as  WBS ) is the core step in project management. It is put forward in 1993 aiming to make the big project more manageable in details. To be more specific, WBS is a structural schematic diagram that decomposes tasks layer by layer according to an internal structure or an implementation process. It breaks down the project into several relatively independent, single content, and easy accounting work units. A great work breakdown structure will lead to better team productivity and comprehensive project m...

How to Use Mind Mapping for Goal Setting

图片
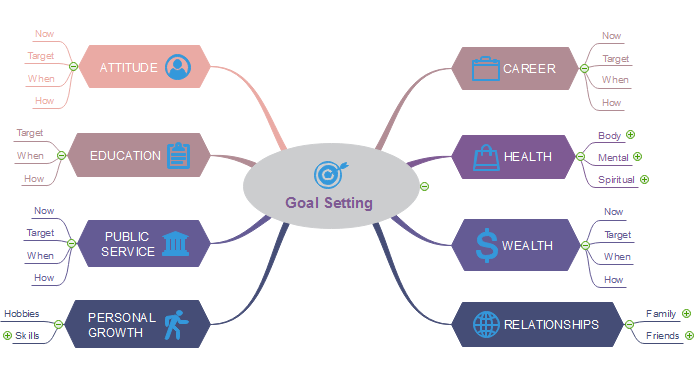
Goal setting is everywhere in our lives. You may set goals for your  health ,  financial plan ,  careers , and all around your daily life. As a consultant, I am familiar with many goal setting approaches of transforming the status quo into future. Today I would like to suggest mind mapping as the best goal setting solution to ensure accomplishments of your goals. You may wonder what mind mapping is, and then I will show you the definition of mind mapping. What is a Goal Setting Mind Map? Mind Mapping is a hot trend in recent years as it has been widely used in education, business, and life management fields all over the world. Originally, the word “mind map” is put forward by Tony Buzan in the late 1960s to offer a visual way when brainstorming. Generally speaking, a mind map is a visual illustration of hierarchical information which contains a central idea with several branches of related evidence. So a goal setting mind map might be an intuitive representation of d...

Event Tree Analysis - The Risk Assessment Application Tool

图片
Event tree analysis is applicable to risk assessment and safety system engineering. It is used to determining the success paths and providing solutions to avoid dangers and accidents. What is Event Tree Analysis? Originating from decision tree analysis, event tree analysis becomes an accident-cognition method of deducing possibilities and outcomes in a chronological order. This approach uses a tree diagram called "event tree" to describe the logical relationship between probable accidents and potential reasons. Through the qualitative and quantitative analysis of the event tree, users can find the main reasons of accidents and provide reliable solutions so as to reach the purpose of speculating and preventing accidents. Qualitative Analysis of Event Tree Qualitative analysis process occurs along with designing process. For this reason, before drawing the event tree, you should analyze the possibility of each process and probable status of each path in accordance wi...

Avoid Mind Fragmentation by Mind Maps

图片
When you look at one word for over 3 minutes, you will find that you may even forget what those words are. Similarly, when you focus on one thing for a long time, you may forget what you are doing and what you need to do. Memory sometimes sets up a trap for what you are really familiar with the particular time. Then you beat your brain but nothing comes to your mind. All the situations indicate fragmentation of your mind. People may wonder whether there is a tool which can avoid fragmentation and enhance memory. The answer is YES, and that tool is a mind map. Users can brainstorm and connect with what is in your mind so as to improve memory. The following passage will introduce how can we  avoid mind fragmentation by mind maps . Stimulate Brain Mind maps can stimulate your brain by visual symbols and colorful icons. Compared with those simplex liner notes, mind maps have a clear focus and accessible length which emphasize on keywords but not long paragraphs without focal...

Fire Escape Diagram Software for Mac

图片
Design a fire escape diagram or evacuation emergency plan easily with ready-made templates and rigorous symbols. Experience an automatic drawing tool to complete typical fire escape diagram. Edraw floor plan maker offers a concise interface for Mac users to draw a professional fire escape diagram rapidly. REASONABLE FIRE ESCAPE DIAGRAM SOFTWARE ON OS X Edraw floor plan maker is a widely used fire escape diagram tool for Mac OS. Different from other diagram drawing software, it provides you with a choice of a lifetime license at an affordable price. With this application, drawing fire escape diagram is not the privilege of specialists but for everyone including beginners. Without masterly drawing skills, users can also have great experience in completing a customized fire escape diagram. NUMEROUS PROFESSIONAL SYMBOLS FOR EVACUATION PLAN Floor plan maker is the optimal choice for designing an accurate and exquisite fire escape diagram as it offers efficient drawing tools and s...

Easy Azure Diagram Software

图片
Easy Azure diagram software contains standardized Azure icons and pre-start templates which benefit from creating professional Azure architecture diagrams with high efficiency. Microsoft Azure used to be named as Windows Azure, is a cloud-based computing platform offered by Microsoft. It provides cloud computing services of the building, structuring, disposing of, storing, and managing applications by global networking data center for developers, programmers, and IT specialists. Azure Diagram Software - Create a Professional-looking Azure Diagram Azure diagram software offers you the full set of Azure basic icons and an easy-to-operate drawing platform. For developers and architecture designers, Edraw enables you to layout the Azure cloud infrastructure rapidly without any designing skills required. There are various advanced functions which will benefit to draw a standard Azure diagram, containing Lasso select tool, auto spacing and alignment, zooming, and geometry operations...

How to Take Meeting Minutes with Mind Maps

图片
Meeting minutes always become nightmares for administrators, officials, secretaries, and assistants especially beginners of users. Choosing a good method of taking meeting minutes will not only give a good impression on your bosses and leaders but also save time. Today I would like to introduce you the way to take meeting minutes with mind maps. Firstly, we should know what exactly a meeting minute is. A meeting minute is a special note only be recorded in the meeting with comprehensive and rational words. People who take minutes need acquiring the capability of impartial and fast-written. There are no personal perspectives which are put forward by note-takers. All they need to do is record what they hear. Compared with a traditional minute-taking method, mind mapping seems more logical and streamline with keywords rather than long sentences and paragraphs. Following are steps of taking meeting minutes by using mind maps. 1. Prepare organizational content and overview before t...

Affinity Diagram - A Six Sigma Tool for Prioritizing Ideas

图片
Affinity Diagram, widely known as K-J method variation, is a tool for problem-solving which is similar to mind mapping. It is one of the most effective technique in Six Sigma method for organizing and prioritizing ideas. What is Affinity Diagram? Affinity diagram , one step of the Six Sigma method, is originally developed by Japanese anthropologist Kawakita Jiro in the 1960s. It is used to organize unstructured ideas and information and link up to form thinking model. Not only do affinity diagrams generate ideas, but ideas will be organized into groups for further analysis. Affinity Diagrams are widely utilized in the fields like business analysis, project management, scholar research, and product management etc. When to Use Affinity Diagram? Group agreement for a discussing conclusion A complicated issue with copious divisions Plenty of disordered information and data After analyzing verbal data 2. How to Prioritize Ideas by Affinity Diagram? 1. Explore Your ...

Pareto Chart - A Six Sigma Tool for Measuring Process Performance

图片
A Pareto chart is a histogram drawn in nominal frequency order to indicate the ratio of results caused by various elements. It is one of the most effective tools in Six Sigma for measuring process performance. What is Pareto Chart? Pareto chart, one step of Six Sigma chart which combines a bar chart and a line chart, is observed by an Italian economist Vilfredo Pareto and generalized by Joseph M. Juran. Previously the main function of this chart is to evaluate which might be the most common cause of the deficiency. Later it is widely used to emphasize the importance reasons among all elements. The horizontal axis of a Pareto chart shows main elements which influence the quality of a program. The sequence of those elements is less and less important from left to right. Besides, left vertical axis of the chart represents the frequency of occurrence while right vertical axis shows the cumulative percentage. Thus, the height of each bar acts as influencing the degree of each ele...

How to Create an Operating Model - Deliver Values

图片
The operating model is a key process for an organization to deliver values to their customers. This page offers you a guide on how to design a logical operating model canvas. Brief Introduction of the Operating Model The operating model is a fundamental part of the business strategy which aims to build a bridge between strategy and operations. With help of this model, this operation team delivers the value of the organization to customers. It contains 6 elements including Supplier, Location, Process, Organization, Information, and Management which can be abbreviated as POLISM model. The operating model canvas converts an ideal strategy into practical choices about operations of the organization like a start-up, a single-business, a collection of businesses, a charity, government department, a firm and a company etc. Basic Terms of the Operating Model - POLISM Canvas P - Process The process of operating model shows detailed steps of an organization delivering their core va...